The CHARISMA information platform has been launched and can be accessed via the button below.
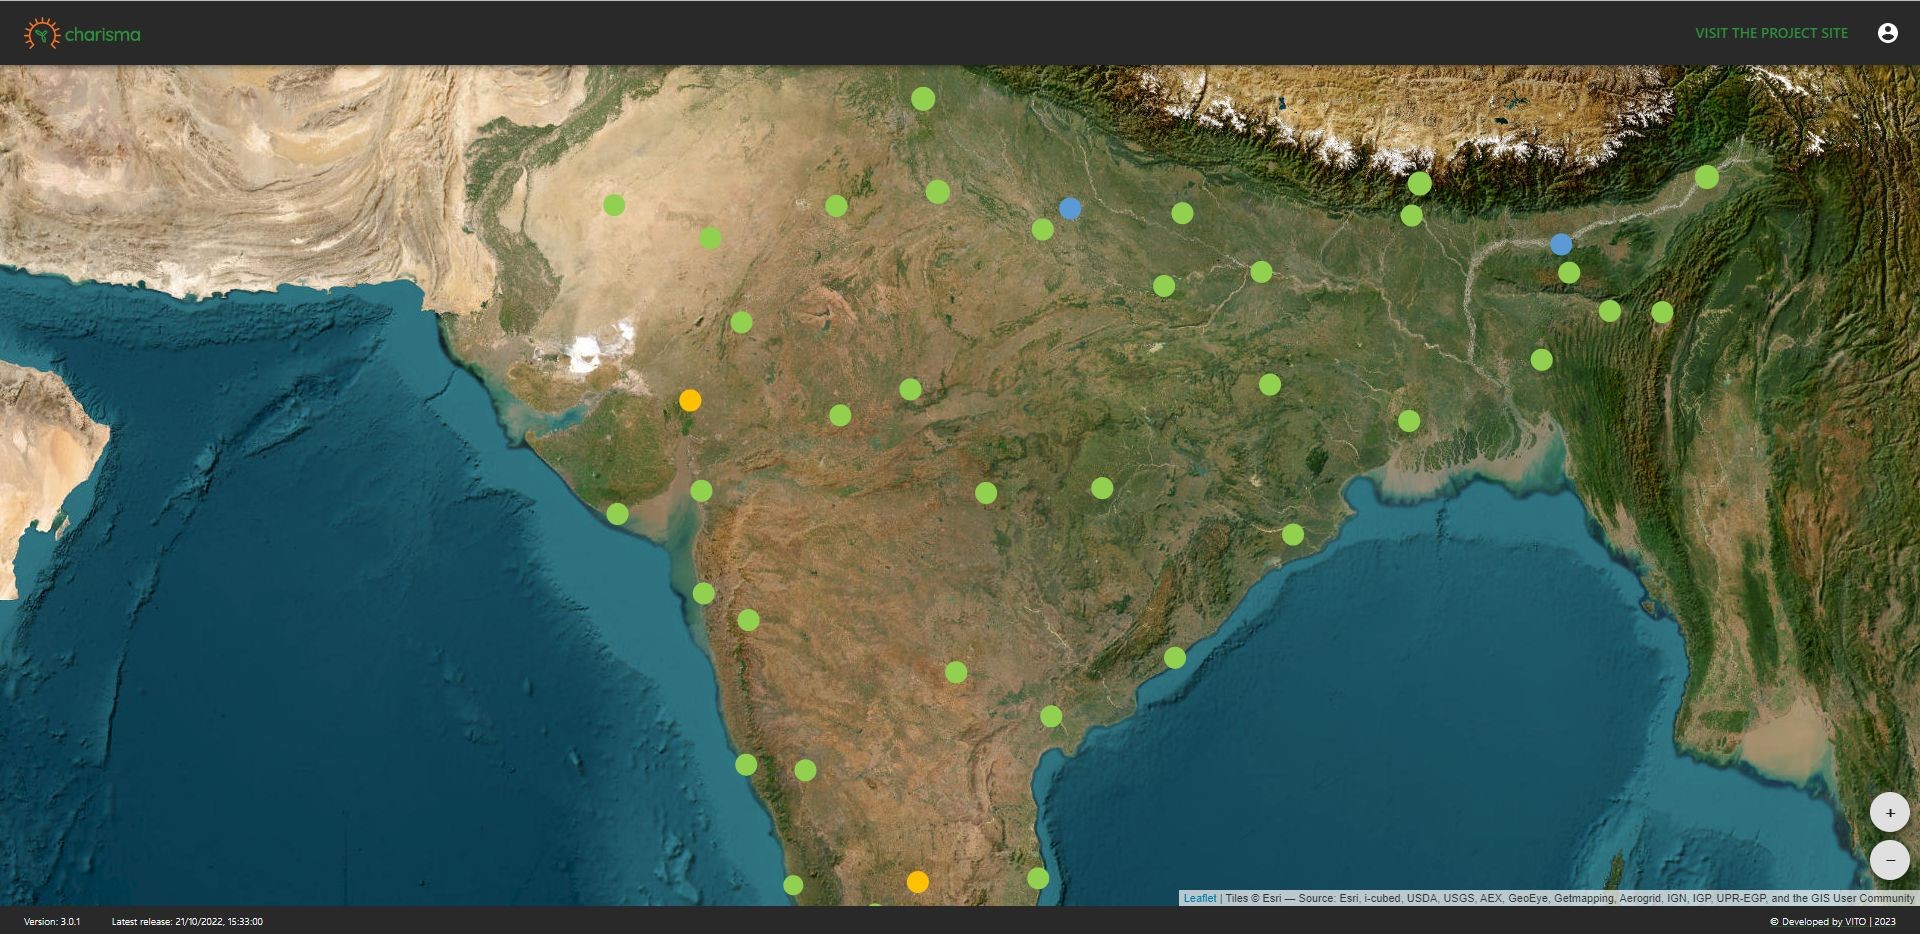
Starting from the overview map, the various cities considered in CHARISMA can be accessed.
Colors of the pins represent the various service levels
- Blue are the demonstration cities for which urban growth, vector-borne disease and climate change are considered.
- Yellow are the intermediate cities for which urban growth and climate change are taken into account.
- Green are the pilot cities for which only climate change impact in terms of heat stress is analyzed.
Except for the demonstration cities, all information is publicly available. Given the information contained, registration is required to access the blue pinned cities.
GIS data
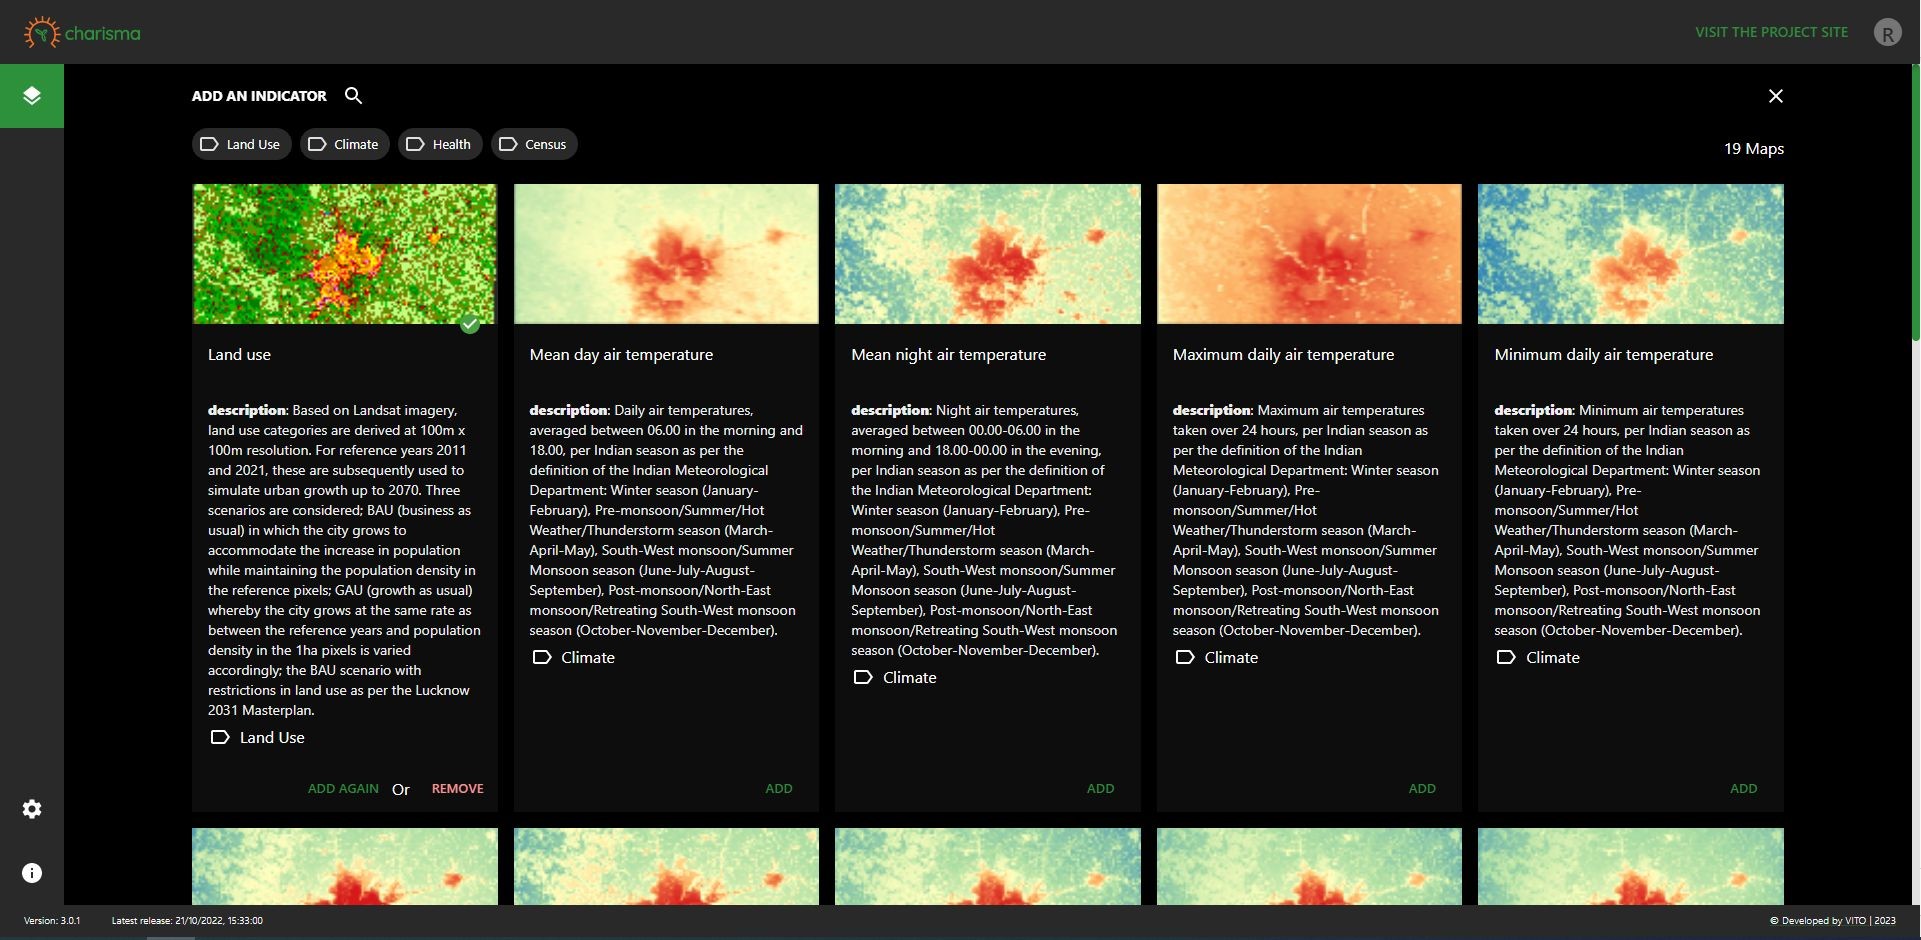
Depending on the choice of city, the information platform contains a wealth of GIS data concerning land use, climate change, health impact and 2011 census data. Data is categorized per theme and can be added by a mere mouse click. For each of the selected indicators additional options are available such as climate change scenario, urban growth scenario, time period, adopted definitions, etc.
Multiple data layers
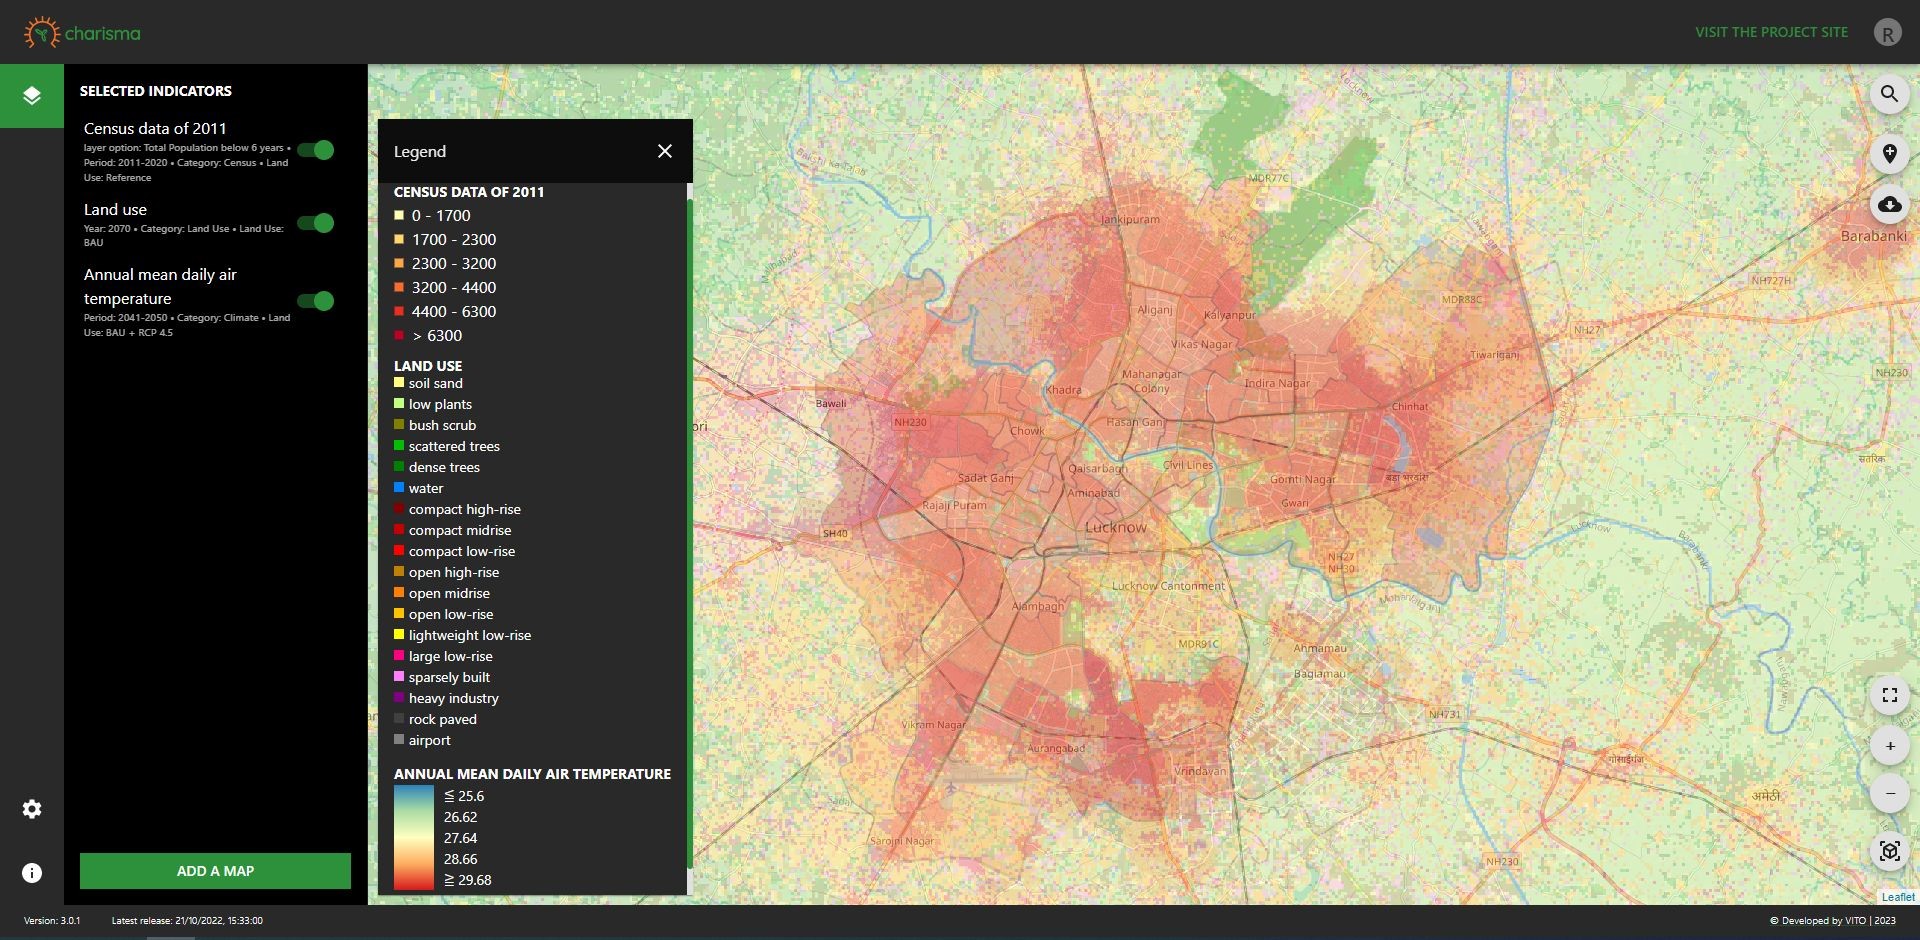
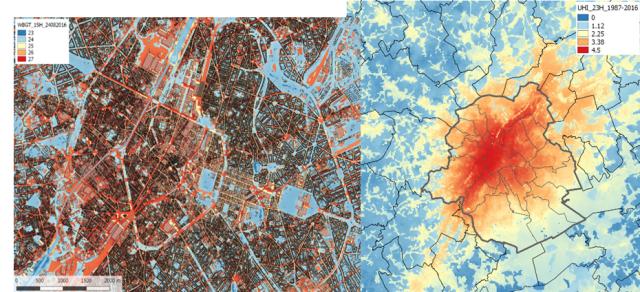
Multiple data layers can be superimposed, highlighting areas requiring further attention. As an example, future land use is overlayed with ward-wise census data concerning the population below 6 years and future (2040-2050) mean daily temperature. Areas which become dark red are expected to become compactly built and prone to higher temperatures, while home to more children (compared to the other wards). This allows authorities to take targeted actions, making the platform a decision support system.
3D maps
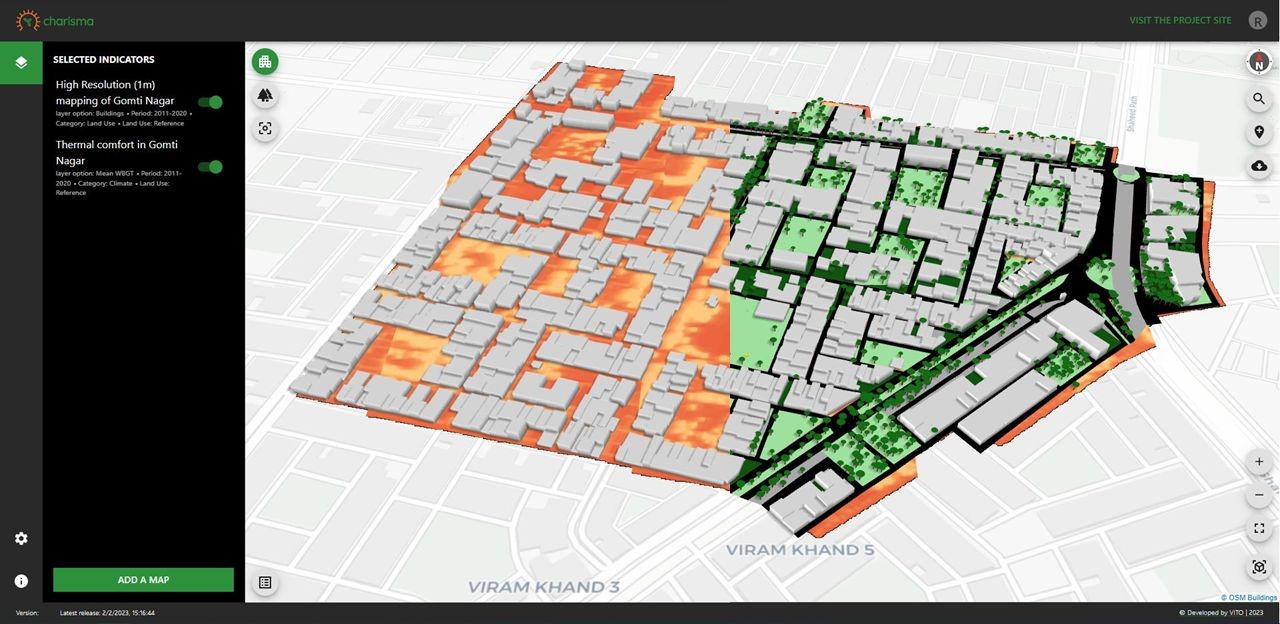
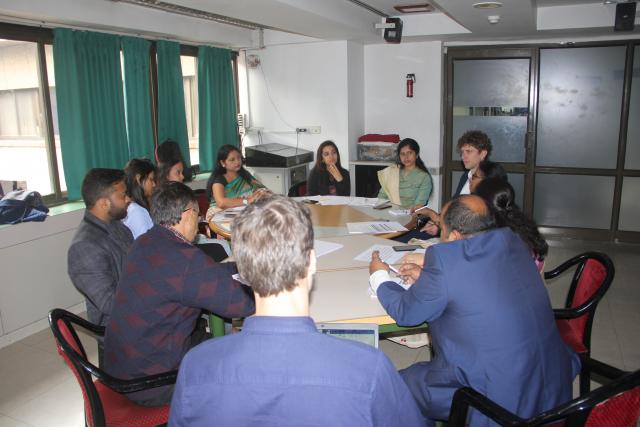
For illustration purposes only, certain areas within the city of Lucknow have also been mapped at high resolution together with students of the Faculty of Architecture and Planning of AKTU. This yields a 3D map of the quarter depicting the location of trees, buildings (scaled by height), grass areas, etc. Moreover, this data at approximately 1m resolution, has been used as input to model thermal comfort at various times throughout a typical hot day. Such high-resolution information permits local authorities to design and plan even more tailored and localized adaptation measures.